Fracture network mapping using Landsat-8 OLI images of the mining zone of Jbel Tijekht in Moroccan Eastern Anti-Atlas.
Mapeo de redes de fracturas mediante imágenes Landsat-8 OLI en la zona minera de Jbel Tijekht en el Anti-Atlas oriental de Marruecos.
Omar Saidi1,*, Hicham Si Mhamdi2, Abdelhafid Essalhi1, Abdeslam Toummite1
1Research team of Geophysics, Georesources and Heritage, Department of Geosciences, Faculty of Sciences and Techniques, Moulay Ismaïl University, BP.509, Boutalamine, 52000 Errachidia, Morocco. ORCID ID: https://orcid.org/0000-0002-5878-2864, https://orcid.org/0000-0002-5777-1100, https://orcid.org/0000-0002-1955-3276
2Research team of Applied Geodynamics and Remote Sensing to Naturel Ressources, Department of Geosciences, Faculty of Sciences and Techniques, Moulay Ismaïl University, BP.509, Boutalamine, 52000 Errachidia, Morocco. ORCID ID: https://orcid.org/0000-0002-9008-2059
*Corresponding author : omarsaidi5885@gmail.com
| |
ABSTRACT
Jbel Tijekht is one of the most important geological structures of the Ougnat-Ouzina ridge in the Eastern Anti-Atlas. This crescent-shaped massif was affected by a network fractures that is visible at different scales. It is particularly rich in numerous mineralized veins of barite, and is associated with other minerals (e.g. pyrite, chalcopyrite, sphalerite and galena).
In order to study fracture systems in the mining zone of Jbel Tijekht, we opted for a combination of remote sensing and field investigation that became an important tool for fracture mapping and mineral exploration. This work presents a methodological approach to detect structural lineaments. For this purpose, various techniques were applied to the Landsat 8 image to improve the visibility of linear structures. After the radiometric and atmospheric corrections, the colors composites and directional filters applied to the Principal component (PC1) allow for the establishment of a lineaments map of Jbel Tijekht. The validation and the correction of lineaments are based on preexisting documents combined with field observations.
Statistical analysis of the lineament map allows for identification of at least three directional fracture systems with average NS, NE-SW, and ENE-WSW orientations. NS and NE-SW systems show a high density in the largest part of the study area. These results clearly overlap different tectonic structures and existing veins. It allowed for the establishment of a geological link between lithology, fractures systems and mineralization. The fracture density can be attributed to the last variscan brittle phases, reflecting the rheology of rock units; the high fracture density is observed in competent rocks such as the
Tabanit sandstones. These zones constitute a favorable area for mineralization deposits.
Keywords: Structural mapping, Lineaments extractions, Variscan, Jbel Tijekht, Ougnat-Ouzina Ridge, Moroccan Eastern Anti-Atlas.
|
| |
RESUMEN
El Jbel Tijekht es una de las estructuras geológicas más importantes de la cordillera de Ougnat-Ouzina en el Anti-Atlas Oriental. Este macizo en forma de media luna fue afectado por una red de fracturas que es visible a diferentes escalas. Es particularmente rico en vetas mineralizadas de barita y está asociado con otros minerales (por ejemplo, pirita, calcopirita, esfalerita y galena).
Para estudiar los sistemas de fracturas en la zona minera de Jbel Tijekht, optamos por una combinación de teledetección e investigación de campo que se convirtió en una importante herramienta para la cartografía de las fracturas y la exploración de minerales. Este trabajo presenta un enfoque metodológico para detectar los lineamientos estructurales. Para ello, se aplicaron diversas técnicas a la imagen del Landsat 8 para mejorar la visibilidad de las estructuras lineales. Tras correcciones radiométricas y atmosféricas, los colores compuestos y los filtros direccionales aplicados al componente principal (PC1) se pudo establecer un mapa de lineamientos para Jbel Tijekht. La validación y corrección de estos lineamientos se basan en documentos preexistentes combinados con observaciones de campo.
El análisis estadístico del mapa de lineamientos permite la identificación de al menos tres sistemas de fractura direccional
con orientaciones promedio NS, NE-SW y ENE-WSW. Los sistemas NS y NE-SW muestran una alta densidad en la mayor parte del área de estudio. Estos resultados claramente se superponen a diferentes estructuras tectónicas y a las vetas existentes. Esto permitió
establecer un vínculo geológico entre la litología, los sistemas de fracturas y la mineralización. La densidad de fracturas puede atribuirse a las últimas fases de fragilidad del orógeno varisco, lo que refleja la reología de las unidades de roca;
la alta densidad de fractura se observa en las rocas competentes como las areniscas de Tabanit. Estas zonas constituyen un área favorable para los depósitos de mineralización.
Palabras clave: Cartografía estructural, Extracciones de lineamientos, Variscan, Jbel Tijekht, Dorsal Ougnat-Ouzina, Anti-Atlas oriental marroquí.
|
IntroductionTOP
Over the last decade, remotely sensed satellite data has been used for detailed geological mapping at district and regional scales. Remote sensing provides a useful approach, especially in basement complexes in which access is low due to the rugged topography. For this reason, remote sensing and the processing of satellite images become more and more necessary, to recognize
geological structures by lithological mapping (Adiri et al., 2017) and lineaments mapping (faults, diaclases, joints, schistosity) (Hashim et al., 2013; Pour & Hashim, 2016). This technique is also applied in hydrogeological and mineral explorations (Marghany & Hashim, 2010). These techniques provide good results especially in arid climates and desert areas where the rock units are exposed (Abdullah et al., 2013; Adiri et al., 2017; Si Mhamdi et al., 2016, 2017; Pour et al., 2017, 2018).
This work focuses on extraction of structural lineaments. It is based on the automatic extraction using algorithms (Argialas et al., 2004; Thannoun, 2013), and the visual interpretation of directional filters, color composites and spectral band ratios, which allow for more accurate mapping of linear or curvilinear discontinuities (El Alaoui El Moujahid et al., 2016; Si Mhamdi et al., 2017; Ta et al., 2014; Youssef et al., 2006).
This study concerns the mining zone of Jbel Tijekht, located in the southern part of the Ougnat-Ouzina Ridge, Eastern Anti-Atlas.
The region benefits from a few geological studies and was only recently the focus of several research studies. Detailed geological
mapping of the area was conducted by Ait Daoud et al., 2020; Baidder et al., 2008, 2016; Benharref et al., 2014b; Destombes & Hollard, 1986; Makkoudi, 1995; and Pouclet et al., 2017, 2018. This paper is a contribution to geological mapping of the mining zone of Jbel Tijekht. It combines remote sensing and field
study. This contribution involves the structural study and the kinematics of fracturing. The resulting map and field work
will allow us the scientific community to understand the tectonic relationship between lineaments and structural elements,
and correlate with the variscan brittle tectonics noted in this region.
Geological FrameworkTOP
The Anti-Atlas belt comprises the northern boundary of the West African Craton (WAC). It is limited by the Hamada of Guir to the East, the Hamada of Kem-Kem to the South, the Atlantic Ocean to the West and the Cretaceous and Tertiary of Errachidia Boudnib basin to the north. The Anti-Atlas chain is in the form of inliers oriented ENE-WSW (Choubert,1947; 1963;Thomas et al., 2004; Gasquet et al., 2005). It is occupied in the center by Precambrian rocks and boarded by the Paleozoic rocks (Figures 1b, 1c).
|
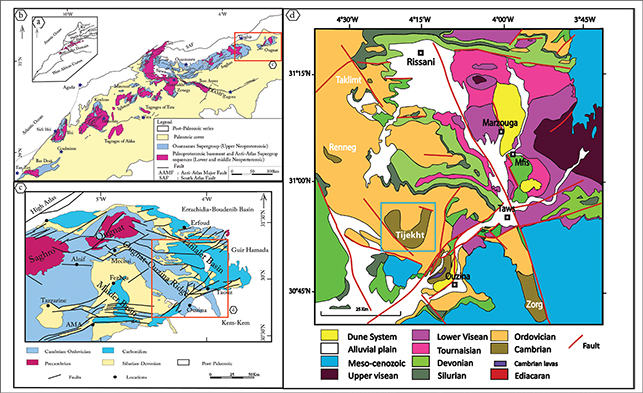 Figure 1.—Geological situation of the study area in a regional framework: a; Map of geological Morocco domains, b; Anti-Atlas geological map showing all Precambrian inliers surrounded by Paleozoic rocks, adapted from 1: 1000000-scale geological map of Morocco (Geologic service of Morocco, 1985), c; Geological map of Eastern Anti-Atlas (Baidder et al., 2016; Benharref et al., 2014; Michard et al., 2008), d; Geological Map of the province of Tafilalet, (Álvaro et al., 2014a, 2014b; Benharref et al., 2014a, 2014b, 2014c; Baidder et al., 2016; Destombes & Hollard, 1986); Bleu rectangle in “d” indicates the study area. Figure 1.—Geological situation of the study area in a regional framework: a; Map of geological Morocco domains, b; Anti-Atlas geological map showing all Precambrian inliers surrounded by Paleozoic rocks, adapted from 1: 1000000-scale geological map of Morocco (Geologic service of Morocco, 1985), c; Geological map of Eastern Anti-Atlas (Baidder et al., 2016; Benharref et al., 2014; Michard et al., 2008), d; Geological Map of the province of Tafilalet, (Álvaro et al., 2014a, 2014b; Benharref et al., 2014a, 2014b, 2014c; Baidder et al., 2016; Destombes & Hollard, 1986); Bleu rectangle in “d” indicates the study area.
|
|
The eastern part of the Anti-Atlas is occupied by two outcrops, the Precambrian inliers of Saghro and that of Ougnat (Gasquet et al., 2005), surround by the Paleozoic lands of Tafilalet, Maider, Rivers Rheris-Jorf and those of Tisdafine (Figure 1a and figure 3). On the other hand, these Precambrian formations are not limited in these two main inliers; they are outcroppings at the southern edge of the Ougnat-Ouzina Ride in the Jbel Tazoult n’Ouzina and at the east of the town of Erfoud in the two localities of Gour Brikat and El Aness (Destombes & Hollard, 1986).
The Ougnat-Ouzina Ridge, where the study area is located, is formed by Paleozoic formations ranging from Cambrian to Ordovician strata; while the eastern and western boundaries (Tafilalet basin and Maider Basin respectively) present the Devonian to Carboniferous strata (Figure 1d). The structuration of this region occurred during the early Paleozoic era and then during the Variscan cycle (Baidder et al., 2016; Michard et al., 2008). The tectonic in the Tafilalet, in the river of Rhèris-Jorf, and in the Maider, is rather to the variscan chain-front type. It is marked by folds with a large radius of curvature and by the abundance of faults (Baidder et al., 2016; Benharref et al., 2014).
The Jbel Tijekht anticline, the object of this study, is located in the southwest of the touristic dunes of Marzouga, precisely at 30 km west of Taouz village. It stretches for more than 15 kilometers west of Tizi n’Rsas. In the study area, the Middle Cambrian and Lower Ordovician mark the two main elements of the Paleozoic cover (Figure 2). They are materialized by detrital sediments crossed by mineralized veins. The structural study of the anticline structure of Tijekht made it possible to relate it to a multiphase variscan deformation (Destombes & Hollard, 1986). This anticline oriented E-W is located north of the ENE-WSW fault corridor of Oumjrane Taouz (Baidder et al., 2016). The crescent shape of Tijekht is made by the second phase of sub-orthogonal folding dated late variscan (Baidder et al., 2016). These folds are very open with axes oriented N-S to NNE-SSW (Figure 2).
Materials and MethodsTOP
MaterialsTOP
To achieve the objectives, an optical Landsat-8 OLI image was used with 9 spectral bands of different wavelengths (Table1). This image was acquired on 25 August 2018 at the L1T (corrected terrain) level, with a Universal Transverse Mercator (UTM) projection and a World Geodetic System WGS 84 datum. The acquisition date is characterized by the scarcity or the absence of clouds in the area of interest.
Table 1.—Landsat-8 OLI spatial and spectral band resolutions (NIR = Near Infrared; SWIR = Short-Wave Infrared).
| Bands |
Spatial Resolution (m) |
Wave length (μm) |
Common name |
| 1 |
30 |
0,433 - 0,453 µm |
Aerosols |
| 2 |
30 |
0,450 - 0,515 µm |
Blue |
| 3 |
30 |
0,530 - 0,590 µm |
Green |
| 4 |
30 |
0,640 - 0,670 µm |
Red |
| 5 |
30 |
0,850 - 0,880 µm |
NIR |
| 6 |
30 |
1,570 - 1,650 µm |
SWIR1 |
| 7 |
30 |
2,110 - 2,290 µm |
SWIR2 |
| 8 |
15 |
0,500 - 0,680 µm |
Panchromatic |
| 9 |
30 |
1,360 - 1,380 µm |
Cirrus |
MethodsTOP
The preprocessing step of the satellite image involves both radiometric calibration and atmospheric corrections, and is critical in order to get a useful scientific product (Chander et al., 2009). This step is followed by a treatment procedure to improve the sharpness of the image and the visibility of geological structures. It includes the color composites, principal component analysis (PCA), spatial filtering and banding ratios (Figure 4).
|
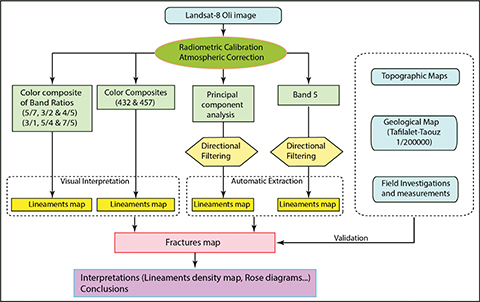 Figure 4.—Methodological approach of lineament extraction from the Landsat-8 Oli image. Figure 4.—Methodological approach of lineament extraction from the Landsat-8 Oli image.
|
|
In this study, two approaches have been used for lineament extraction:
| 1) |
Visual interpretation: This method corresponds to manual tracing of the observed lineament in the input data. In this study, the visual interpretation was applied to the band ratios and on the color composite in the true colors (432 in RGB respectively), with the aim of combining its results with the results obtained by automatic extraction (Figures 4, 5 & 8).
|
| 2) |
Automatic extraction: Before the automatic extraction, a visual aspiration of Oli8 bands and principal components were tested to identify the most suitable input for lineament extraction. Since the lineament extraction is based on the spatial resolution and the relief visibility, we selected band 5 and PC1 where the lineaments are well interpreted. Subsequently, tests were applied to different types of filters to the inputs (Band 5 and PC1) in order to increase the visibility of lineaments
(Figures 4, 6 & 7). Then, the automatic extraction was applied to the direction filters using the most widely used algorithm LINE extraction
of the PCI Geomatica software (Anbalagan et al., 2015; Mandal & Maiti, 2014; Matori et al., 2012). Algorithm of this LINE modular runs mainly in three phases: edge detection, thresholding and curve extraction. However, LINE module extracts lineaments from an image and converts these linear features to vector form by taking consideration of six optional parameters (RADI, GTHR, LTHR, FTHR, ATHR, and DTHR). These parameters can be defined by the user depending on image resolution and lineament density (www.pcigeomatics.com). In order to obtain the most appropriate lineaments related to the tectonic setting of the studied area, we suggested the following optimum values for LINE modular parameters (Table 2). These parameters are explained briefly according to (www.pcigeomatics.com): |
|
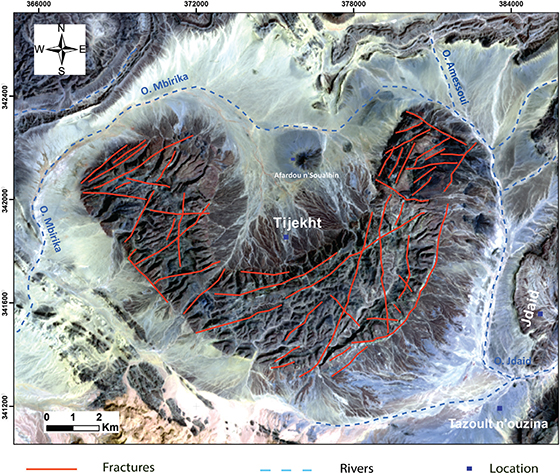 Figure 5.—Color composite of bands 4, 3 and 2 in RGB, respectively; true-color mosaic image of the study area resulted from pre-processing, and lineaments extracted from manual methods. Figure 5.—Color composite of bands 4, 3 and 2 in RGB, respectively; true-color mosaic image of the study area resulted from pre-processing, and lineaments extracted from manual methods.
|
|
|
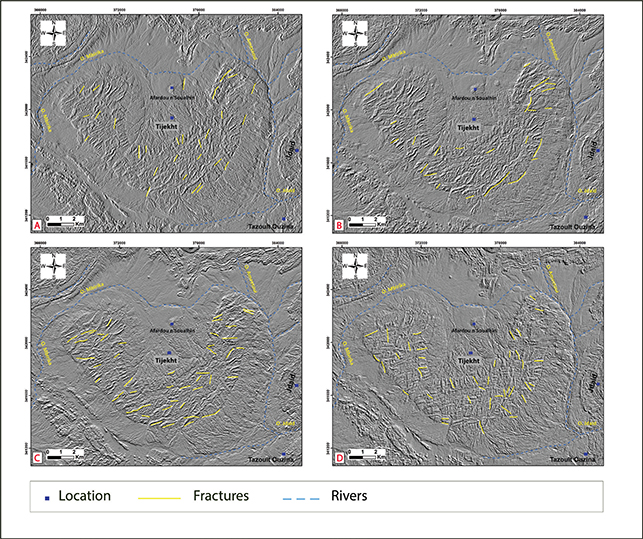 Figure 6.—Extracted lineaments from spatial filtering of the principal component analysis. A Filter NS. B Filter NE-SW. C Filter E-W. D Filter NW-SE. Figure 6.—Extracted lineaments from spatial filtering of the principal component analysis. A Filter NS. B Filter NE-SW. C Filter E-W. D Filter NW-SE.
|
|
|
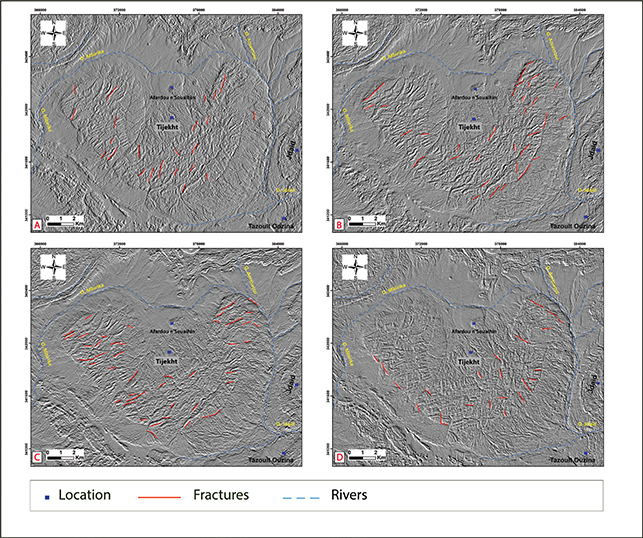 Figure 7.—Extracted lineaments from spatial filtering of the band 5. A Filter NS. B Filter NE-SW. C Filter E-W. D Filter NW-SE. Figure 7.—Extracted lineaments from spatial filtering of the band 5. A Filter NS. B Filter NE-SW. C Filter E-W. D Filter NW-SE.
|
|
|
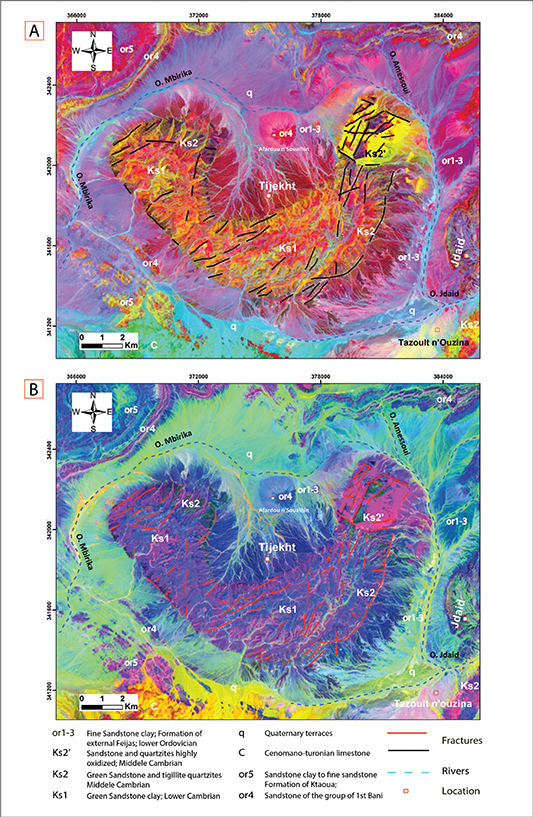 Figure 8.—Extracted lineaments from visualization interpretation of bands rationing (B5/B7, B3/B2 and B4/B5) and (B3/B1, B5/B4 and B7/B5) in RGB, respectively. Figure 8.—Extracted lineaments from visualization interpretation of bands rationing (B5/B7, B3/B2 and B4/B5) and (B3/B1, B5/B4 and B7/B5) in RGB, respectively.
|
|
Table 2.—Used parameters for lineament extraction in this study.
| Parameter |
Code |
Value |
| Filter Radius |
RADI |
60 |
| Edge Gradient Threshold |
GTHR |
10 |
| Curve Length Threshold |
LTHR |
60 |
| Line Fitting Error Threshold |
FTHR |
3 |
| Angular Difference Threshold |
ATHR |
15 |
| Linking Distance Threshold |
DTHR |
10 |
RADI = Filter radius: specifies the radius of the edge detection filter in pixels. It roughly defines the smallest-detail level in the input image to be detected. The data range for this parameter is between 0 and 8192.
GTHR = Gradient threshold: specifies the threshold in pixels for the minimum gradient level for an edge pixel to obtain a binary image. The data range for this parameter is between 0 and 255.
LTHR = Length threshold: expounds the minimum length of curve in pixels to be considered as lineament or for further consideration; such as, the linking with other curves. The data range for this parameter is between 0 and 8192.
FTHR = Line fitting error threshold: specifies the maximum error in pixels, allowed when fitting a polyline to a pixel curve. Low FTHR values give better fitting but also shorter segments in polyline. The data range for this parameter is between 0 and 8192.
ATHR = Angular difference threshold: the parameter which specifies the maximum angle in degrees, between segments of a polyline. Otherwise, if the angle exceeds the specified maximum, the polyline is segmented into two or more vectors. This angle also defines the maximum angle between two vectors for them to be linked. The data range for this parameter is between 0 and 90.
DTHR = Linking distance threshold: this measurement is the parameter which specifies the minimum distance in pixels, between the ends points of two vectors
for them to be linked. The data range for this parameter is between 0 and 8192.”
The control and validation of these results are based on the use of topographic and geological maps made in the region, such as the Tafilalet-Taouz geological map, as well as courses and field investigations (Figure 4).
Color compositeTOP
The creation of color composition (RGB) which consists of assigning three spectral bands of a satellite sensor to each of the three colors (Red, Green, and Blue). The analysis of these compositions requires an interpretation of the spot coming from the identical ranges of color corresponding theoretically to the same object, on the basis of calculation of the Optimal Index Factor (OIF) (Abrams et al., 1983; Si Mhamdi et al., 2017).
Spectral Band RationingTOP
The application of band ratios makes it possible to reduce the topographic effects through mathematical operations (Dembele, & Xiufen Ye, 2017; El Janati, 2019). It also improves the ability to specify the boundaries between the lithological units as a function of their mineralogical composition and the development of crystals (El Janati, 2019; Schowengerdt, 2006; Si Mhamdi et al., 2017), otherwise the improvement of different spectral signature between bands.
Spectral relationships based on a mathematical correlation between pixel values in wavelengths target the reflectance and absorption characteristics of minerals (El Janati, 2019), which contribute to a better approach to gain spectral information in regions where brightness values may vary due to topographic influences. It is the most widely adopted method to discriminate between different lithologies (Adiri et al., 2016; Si Mhamdi et al., 2017). The choice of bands is related to the spectral difference of the material with respect to its environment (Si Mhamdi et al., 2017; Thannoun, 2013).The application of the combinations of previous studies (Esamaldeen, 2012; Adiri et al., 2016; Si Mhamdi et al., 2017; Yousefi et al., 2018), did not allow for specification of the exact limit between these two lithological groups. For this reason, the present study adopted combinations according to the reflectance of the formations targeted, and it appears that the ratios (5/7, 3/2 & 4/5) and the ratios (3/1, 5/4 & 7/5) in RGB respectively are considered to be the best reports of bands, due to their ability to improve the spectral reflectance of lithology and linear structures (Figure 8).
The principal component analysisTOP
Principal Component Analysis (PCA) is an efficient technique broadly used for geological mapping (Adiri et al., 2018, 2016; Amer et al., 2012; Gad & Kusky, 2007; Pour & Hashim, 2011, 2012; Si Mhamdi et al., 2016, 2017). This method consists of defining the new bands (Principal Components (PCs)) which sum up the information contained in several bands in a multispectral space (Ahmad Irouhani et al., 2017; Dembele & Xiufen Ye, 2017; El Alaoui El Moujahid et al., 2016; Estornell et al., 2013; Franchi et al., 2016). Sometimes the information filed in 5 or 6 bands is condensed into two or three components by this analysis (Si Mhamdi et al., 2017). This mathematical transformation aims to statistically maximize the amount of variance of the original data in a small
number of components (Franchi et al., 2016; Pour et al., 2017).
However, principal component analysis (PCA) produces new channels. These channels make it possible to create colored compositions, constituting an excellent visual interpretation. In addition, they increase the contrast between the various objects on the ground. Given their good quality, we decided to use the first component (CP1) in the automatic extraction of linear structures (Figure 6).
Control and validation of lineamentsTOP
The characterization and the validation of the lineaments extracted from the satellite images and the determination of the possible chronological relations between the different directional families are the main objectives of the work done on the ground. In addition, the control of these fractures relates to the elimination of linear structures corresponding to different morphological and topographical parameters, such as the ridge lines, the tracks, the hues, the rivers, etc. Also to the comparison of result lineaments map with the fracturing map made on the basis of field data and pre-existing structural data (Figures 9,10 & 11). However, the realization of a fracturing map based on field observations, and collected fracture measurements helped us to confirm the linear structures, and to determine their kinematics and the tectonic events affecting the area.
|
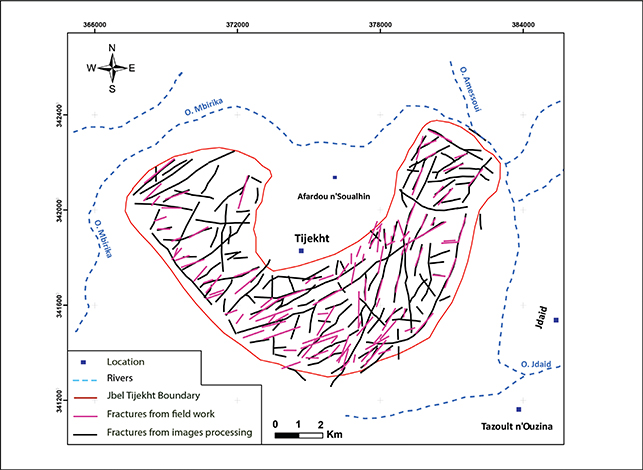 Figure 9.—Fractures map validation and control; superposition of the results from images processing and the results from fieldwork. Figure 9.—Fractures map validation and control; superposition of the results from images processing and the results from fieldwork.
|
|
|
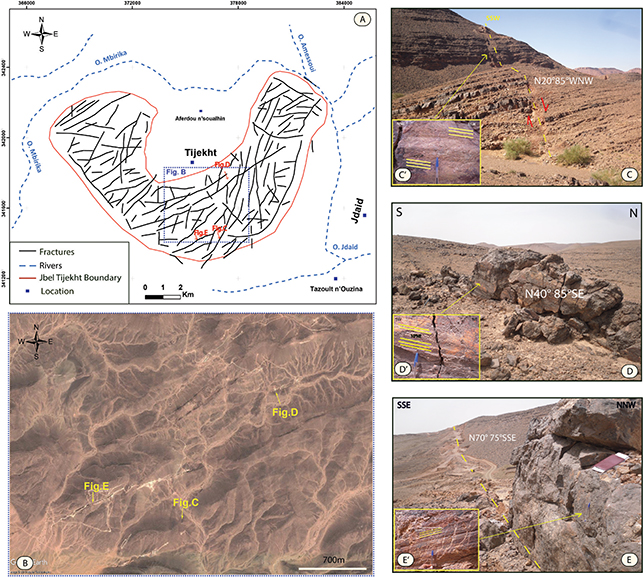 Figure 10.—Lineaments Validation: A; Synthetic lineament map. B; Image extracted from Google earth showing the emplacement of some linear structure extracted from image processing. C, D, and E; show Field Photographs of linear structure (faults) in the Jbel Tijekht. C’, D’ and E’; show Photographs of Fault Plan carry striations. Figure 10.—Lineaments Validation: A; Synthetic lineament map. B; Image extracted from Google earth showing the emplacement of some linear structure extracted from image processing. C, D, and E; show Field Photographs of linear structure (faults) in the Jbel Tijekht. C’, D’ and E’; show Photographs of Fault Plan carry striations.
|
|
|
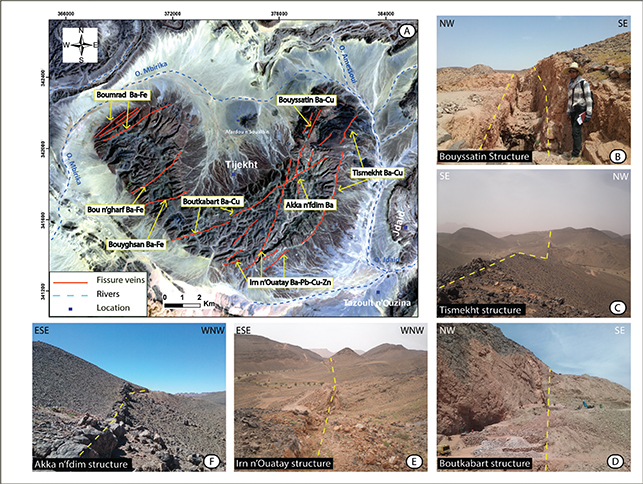 Figure 11.—A: Extract from the Landsat satellite image of study area showing the place of the most important mineralized structures. From B to F: Field photographs showing some mineralized structures mentioned in the map. Figure 11.—A: Extract from the Landsat satellite image of study area showing the place of the most important mineralized structures. From B to F: Field photographs showing some mineralized structures mentioned in the map.
|
|
The control and validation step is essential to evaluate the relevance of the data obtained and the validity of the method used. In addition, this step allows for the determination of the structural significance of the fracturing extracted from the Landsat images, in order to use the results without the tectonic evaluation.
Results and DiscussionTOP
Structural lineaments mappingTOP
Color composites TOP
Based on the high OIF, triples of groups are considered significant and used as color channels for an RGB image. The combinations 432 and 457 of the RGB, respectively, were selected on the basis of a set of tests carried out previously. The analysis of the selected compositions allowed for establishment of visual interpretations on some lineaments which will be extracted later (Figure 5).
Directional filtering of the PC1 and Band 5TOP
The results from the application of directional filters (NS, NE-SW, EW and NW-SE) to the first component analysis (PC1) and the band 5 will be used to create a structural map of the study area (Figures 6 & 7). The characterization and validation of the linear structures have been carried out based on the field and bibliographic data (geological maps of Tafilalet-Taouz 1/200000 (Destombes & Hollard, 1986) and of Al Atrous 1/50000; (Benharref et al., 2014b)).
Band ratiosTOP
In the present work, the chosen technique aims to make a visual interpretation (manual tracing) of different linear structures observed to be intersecting the Middle Cambrian lithological groups, bordered by the Ordovician lithological groups (or1 to or5) which constitute the study area. After the difficult distinguishing and despite the resemblance of the outcrops of the study area Jbel Tijekht, the boundary between its facies are very well distinguished and exhibit the classification of the facies. So, by the ratios (5/7, 3/2 & 4/5) in RGB respectively, we can identify the quaternary (q) in green and soft green to yellow; the pelitic formations, so called “ Schistes à paradoxides (Ks1)” in sky blue and lavender blue; the Tabanit sandstones (Ks2), representing the carapace of Jbel Tijekht, in dark blue, purple and purplish-pink (Ks2’); the Ordovician lithological groups (or1 to or5) in dark blue and purple; and the Cretaceous units (c) in yellow to dark orange (Figure 8).
Control and validation TOP
The combination of the different results obtained by processing satellite images allowed us, after the elimination of repetitions, to make a synthetic map (Figure 9) that will be validated with the data field and the published geological map of the Tafilalet-Taouz region, (Destombes & Hollard, 1986).
The observation of the synthetic structural map of lineaments (Figure 9) allowed us to notice a major trend between the results obtained by the processing of satellite images and the field work, and with the pre-existing data in the map of Tafilalet-Taouz. The coincidence of lineaments extracted from Landsat-8 Oli data with the major fault directions suggests that some faults in some locations have been correctly identified in the study area (Figure 9 and 10A). However, we didn’t take in consideration the non-structural lineaments (e.g. ridge line, track, shade, etc.).
The results obtained show some similarities, although this superposition is sometimes translated through several segments (Figure 9), which may be related to the spatial resolution of satellite images (30 m) or the invisibility of lineaments in these areas. These linear structures correspond to non-mineralized faults (Figure 10) and mineralized faults (Figure 11). Some faults can postpone microstructures, allowing for comprehension of the movements that they generate namely the striations and the steps of tearing. The figure 10 (C’, D’ and E’) show a sub-horizontal striated fault plane, involving the sense of movement of those faults.
The mineralization at Jbel Tijekht mining zone materialized in the form of numerous veins, with variable length that can reach more than one kilometer. However, the most important vein structures in terms of thickness and length are: Tismekht, Bouyssatin, Akka n’Fdim, Boutkabart, Irn n’Ouatay, Bouyghsan, Bou n’Gharf, and Boumrad (Figure 11). The NE-SW directions are the main vectors of the mineralization of barite, copper, lead and zinc in the Jbel Tijekht mining zone, in the vein fields, which is part of the mining domain of Tafilalet.
Structural lineaments analysis TOP
Orientation and length frequencyTOP
After the validation, the synthetic map shows 227 lineaments widespread throughout the study area, with length that varies from 200 m to 5200 m. Figure 13a, which diagrams length frequency of lineaments with a classis of 400m, indicates that over 70% of lineaments are between 400m and 1200m in length.
A statistical analysis of the lineaments orientations, with an angular spacing 10°, revealed that the most of the lineaments have a direction between N0° and N90° with modes around N30° and N60° (Figure 12b). Field data also shows a distribution of lineaments from N0° to N90°; however, the main mode is the N45° (Figure 12c). This finding may be due to the lower resolution of the image, and resulting inability to detect small fractures.
|
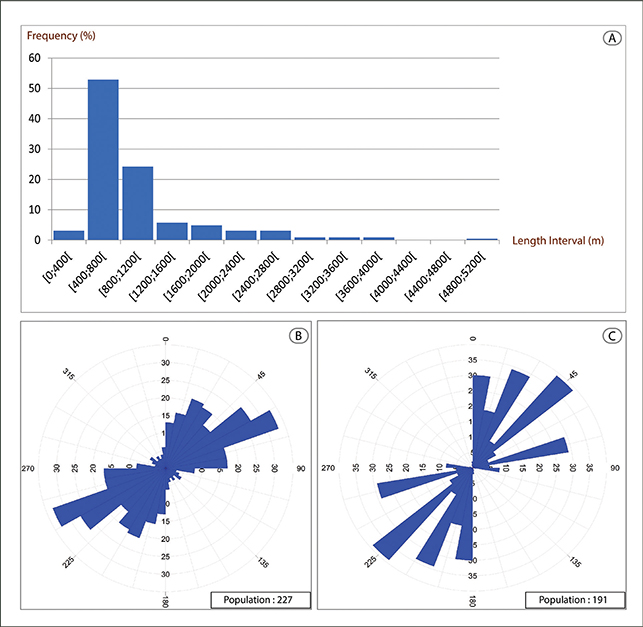 Figure 12.—Statistical analysis of the lineaments orientations: A, Histogram showing the frequency by length of the Jbel Tijekht fractures extracted from remote sensing. B, Rose diagramm of fractures from image processing. C, Rose diagramm of fractures from fieldwork. Figure 12.—Statistical analysis of the lineaments orientations: A, Histogram showing the frequency by length of the Jbel Tijekht fractures extracted from remote sensing. B, Rose diagramm of fractures from image processing. C, Rose diagramm of fractures from fieldwork.
|
|
Lineament DensityTOP
The density parameter is widely used in studies of the lineaments. The used algorithm “Line Density” provides information on the concentration of lineaments per unit area (ArcGIS manual; Silverman, 1986, 1981). In the produced density map (Fig. 13), the value of the output cell corresponds to the total length of the lineaments contained in a search radius of 1 km and whose center is the center of the output cell. The output density unit is kilometers per square kilometers.
In the present work, the density used to find the relationships between the areas of high density of lineaments and geological features (measured faults, veins and lithological units). The results obtained show high density in area where the lithological units are competent, such as the Tabanit sandstone. However, the overall analysis of this density map showed that the areas of high density occupied the majority of the studied area (Figure 13). The most important density values are mainly concentrated in the Jbel Tijekht carapace (Tabanit sandstone) where fracturing is materialized, whereas most of the weak values (medium to low densities) are located in places where the lithological units are tender (Pelitic formation). This finding implies the fragile rheological behavior of the Cambrian lands of the Jbel Tijekht.
The areas with a high density of lineament may constitute a favorable zone to the circulation of hydrothermal fluids and the formation of mineralized deposits. The throw of these fractures shows a great influence on fluid retention and the setting up of mineralization, which is very apparent in field observations.
ConclusionsTOP
The present study is a contribution to structural mapping that used spatial remote sensing combined with field work (classical methods). This paper presents a contribution of satellite imagery type Landsat-8 Oli in structural mapping of the inaccessible area in the south-east Moroccan region. Taking into consideration that most fractures contain mineralization with economic value, the established fracture map combined with field data will be useful and a valuable target for advanced metallogenic researches and mineral exploration in the Jbel Tijekht. Moreover, this study provides a clarification about structural analysis on the study areas.
In conclusion, the present study reveals that the major directions of fractures in crescent-shaped massif of Jbel Tijekht are NS, NE-SW, and ENE-WSW with some NW-SE fractures. This network of fractures constitutes the main marker of the variscan rotational constraint from NS to E-W with a paroxysmal position towards the N60°. This fracturing intensity implies a fragile rheological behavior of the Cambrian lands of the Jbel Tijekht. Fragile tectonics and the alternation of competent (Tabanit Sandstone) and incompetent levels (Pelitic formation called “Schistes à paradoxides”) have a primordial role in the structuration of Jbel Tijekht, which can be attributed to the last variscan brittle phases.
ACKNOWLEDGMENTSTOP
We would like to thank the anonymous reviewers for their critical and constructive feedback, comments and suggestions. The authors also wish to thank Mrs Ana Vasan for contributing to the development of the English language of the article.
We also would like to thank the Researches Teams: “Geophysics, Georesources and Heritage (RT-GGH)” and “Applied Geodynamics and Remote Sensing in Naturel Ressources” Department of Geosciences, Faculty of Sciences and Technics, Errachidia, Moulay Ismail University, Morocco, for supporting this work.
ReferencesTOP
| ○ |
Abdullah, A.; Nassr, S. & Ghaleeb, A. (2013). Landsat ETM-7 for lineament mapping using automatic extraction technique in the SW part of Taiz Area, Yemen. Global Journal of Human-Social Science Research, 13: 35-37. |
| ○ |
Abrams, M.J.; Brown, D.; Lepley, L. & Sadowski, R. (1983). Remote sensing for porphyry copper deposits in southern Arizona. Economic Geology, 78: 591-604. https://doi.org/10.2113/gsecongeo.78.4.591 |
| ○ |
Adiri, Z.; El Harti, A.; Jellouli, A.; Maacha, L.; Azmi, M.; Zouhair, M. & Bachaoui, E.M. (2020). Mineralogical mapping using Landsat-8 OLI, Terra ASTER and Sentinel-2A multispectral data in Sidi Flah-Bouskour inlier, Moroccan Anti-Atlas. Journal of Spatial Science, 65(1): 147-171. https://doi.org/10.1080/14498596.2018.1490213 |
| ○ |
Adiri, Z.; El Harti, A.; Jellouli, A.; Lhissou, R.; Maacha, L.; Azmi, M.; Zouhair, M. & Bachaoui, E.M. (2017). Comparison of Landsat-8, ASTER and Sentinel 1 satellite remote sensing data in automatic lineaments extraction: A case study of Sidi Flah-Bouskour inlier, Moroccan Anti Atlas. Advances in Space Research, 60: 2355-2367. https://doi.org/10.1016/j.asr.2017.09.006 |
| ○ |
Adiri, Z.; El Harti, A.E.; Jellouli, A.; Maacha, L. & Bachaoui, E.M. (2016). Lithological mapping using Landsat 8 OLI and Terra ASTER multispectral data in the Bas Drâa inlier, Moroccan Anti Atlas. Journal of Applied Remote Sensing, 10: 016005. https://doi.org/10.1117/1.JRS.10.016005 |
| ○ |
Ahmad Irouhani, R.; Rahimi, B.; Karimpour, M.H.; Malekzadeh Shafaroudi, A.; Afshar Najafi, S. & Pour, A.B. (2017). Fracture mapping of lineaments and recognizing their tectonic significance using SPOT-5 satellite data: A case study from the Bajestan area, Lut Block, east of Iran. Journal of African Earth Sciences, 134: 600-612. https://doi.org/10.1016/j.jafrearsci.2017.07.027 |
| ○ |
Ait Daoud, M.; Essalhi, A.; Essalhi, M. & Toummite, A. (2020). The role of variscan shortening in the control of mineralization deposition in Tadaout-Tizi n’Rsas mining district (Eastern Anti-Atlas, Morocco). Bulletin of The Mineral Research and Exploration, 161(161): 1-10. https://doi.org/10.19111/bulletinofmre.524167 |
| ○ |
Álvaro, J.J.; Aretz, M.; Benharref, M.; Hibti, M.; Pouclet, A.; El Hadi, H.; Koukaya, A.; Ettachfini, E.M. & Boudad, L. (2014a). Carte géologique du Maroc au 1/50 000, feuille Tawz-Mémoire explicatif. Notes et Mémoires du Service Géologique du Maroc, 551. |
| ○ |
Álvaro, J.J.; Benharref, M.; Hibti, M. & Boudad, L. (2014b). Carte géologique du Maroc au 1/50,000, feuille Irara. Notes et Mémoires du Service Géologique du Maroc, 552. |
| ○ |
Amer, R.; Sultan, M.; Ripperdan, R. & Encarnación, J. (2012). Structural Architecture for Development of Marginal Extensional Sub-Basins in the Red Sea Active Rift Zone. International Journal of Geosciences, 03: 133-152. https://doi.org/10.4236/ijg.2012.31016 |
| ○ |
Anbalagan, R.; Kumar, R.; Lakshmanan, K.; Parida, S. & Neethu, S. (2015). Landslide hazard zonation mapping using frequency ratio and fuzzy logic approach, a case study of Lachung Valley, Sikkim. Geoenvironmental Disasters, 2: 6. https://doi.org/10.1186/s40677-014-0009-y |
| ○ |
Argialas, M.; Mavrantza, O. & Stefouli, M. (2004). Automatic mapping of tectonic lineaments (faults) using methods and techniques of Photointerpretation / Digital Remote Sensing and Expert Systems, Thales project, 1174(6). |
| ○ |
Baidder, L.; Michard, A.; Soulaimani, A.; Fekkak, A.; Eddebbi, A.; Rjimati, E.-C. & Raddi, Y. (2016). Fold interference pattern in thick-skinned tectonics; a case study from the external Variscan belt of Eastern Anti-Atlas, Morocco. Journal of African
Earth Sciences, 119: 204-225. https://doi.org/10.1016/j.jafrearsci.2016.04.003 |
| ○ |
Baidder, L.; Raddi, Y.; Tahiri, M. & Michard, A. (2008). Devonian extension of the Pan-African crust north of the West African craton, and its bearing on the Variscan foreland deformation: evidence from eastern Anti-Atlas (Morocco). Geological Society, London, Special Publications, 297: 453-465. https://doi.org/10.1144/SP297.21 |
| ○ |
Benharref, M.; Hibti, M.; Pouclet, A.; El Hadi, H. & Koukaya, A. (2014c). Carte géologique du Maroc au 1/50 000, feuille Mfis-Mémoire explicatif. Notes et Mémoires du Service Géologique du Maroc, 554. |
| ○ |
Benharref, M.; Álvaro, J.J.; Hibti, M.; Pouclet, A.; El Hadi, H.; Koukaya, A. & Ettachfini, E.M. (2014b). Carte géologique du Maroc au 1/50 000, feuille Al Atrous-Mémoire explicatif. Notes et Mémoires du Service Géologique du Maroc, 555. |
| ○ |
Benharref, M.; Álvaro, J.J.; Hibti, M.; Pouclet, A.; El Hadi, H. & Boudad, L. (2014a). Carte géologique du Maroc au 1/50 000, feuille Marzouga-Mémoire explicatif. Notes et Mémoires du Service Géologique du Maroc, 553. |
| ○ |
Chander, G.; Markham, B.L. & Helder, D.L. (2009). Summary of current radiometric calibration coefficients for Landsat MSS, TM, ETM+, and EO-1 ALI sensors. Remote Sensing of Environment, 113: 893-903. https://doi.org/10.1016/j.rse.2009.01.007 |
| ○ |
Choubert, G. (1963). Histoire Géologique du Précambrien de l’Anti-Atlas. Notes et Mémoires du Service Géologique du Maroc, 162. |
| ○ |
Choubert, G. (1947). L’accident majeur de l’Anti-Atlas. Comptes Rendus de l’Academie des Sciences, Paris, 224 : 1172-1173. |
| ○ |
Dembele, A. & Ye, X. (2017). Spatial Analysis of Linear Structures in the Exploration of Groundwater. ISPRS International Journal of Geo-Information, 6: 335. https://doi.org/10.3390/ijgi6110335 |
| ○ |
Destombes, J. & Hollard, H. (1986). Carte géologique du Maroc au 1/200 000, feuille Tafilalt-Taouz. Notes et Mémoires du Service Géologique du Maroc, 244 pp. |
| ○ |
El Alaoui El Moujahid, H.; Ibouh, H.; Bachnou, A.; Ait Babram, M. & El Harti, A. (2016). Análisis de fracturas geológicas extraídas por teledetección en imágenes Landsat TM, ejemplo de la zona de Imilchil-Tounfite (Alto Atlas central, Marruecos). Estudios Geológicos, 72: 051. https://doi.org/10.3989/egeol.42328.394 |
| ○ |
El Janati, M. (2019). Application of remotely sensed ASTER data in detecting alteration hosting Cu, Ag and Au bearing mineralized zones in Taghdout area, Central Anti-Atlas of Morocco. Journal of African Earth Sciences, 151: 95-106. https://doi.org/10.1016/j.jafrearsci.2018.12.002 |
| ○ |
Esamaldeen, A. (2012). Landsat ETM+7 Digital Image Processing Techniques for Lithological and Structural Lineament Enhancement: Case Study Around Abidiya Area, Sudan. The Open Remote Sensing Journal, 5: 83-89. https://doi.org/10.2174/1875413901205010083 |
| ○ |
Estornell, J.; Martí-Gavliá, J.M.; Sebastiá, M.T. & Mengual, J. (2013). Principal component analysis applied to remote sensing. Modelling in Science Education and Learning, 6: 83-89. https://doi.org/10.4995/msel.2013.1905 |
| ○ |
Franchi, G.; Angulo, J. & Sejdinović, D. (2016). Hyperspectral image classification with support vector machines on kernel distribution embeddings IEEE International Conference on Image Processing, 1898-1902. https://doi.org/10.1109/ICIP.2016.7532688 |
| ○ |
Gad, S. & Kusky, T. (2007). ASTER spectral ratioing for lithological mapping in the Arabian-Nubian shield, the Neoproterozoic Wadi Kid area, Sinai, Egypt. Gondwana Research, 11: 326-335. https://doi.org/10.1016/j.gr.2006.02.010 |
| ○ |
Gasquet, D.; Levresse, G.; Cheilletz, A.; Azizi-Samir, M.R. & Mouttaqi, A. (2005). Contribution to a geodynamic reconstruction of the Anti-Atlas (Morocco) during Pan-African times with the emphasis on inversion tectonics and metallogenic activity at
the Precambrian-Cambrian transition. Precambrian Research, 140: 157-182. https://doi.org/10.1016/j.precamres.2005.06.009 |
| ○ |
Hashim, M.; Ahmad, S.; Johari, M.A.M. & Pour, A.B. (2013). Automatic lineament extraction in a heavily vegetated region using Landsat Enhanced Thematic Mapper (ETM+) imagery. Advances in Space Research, 51: 874-890. https://doi.org/10.1016/j.asr.2012.10.004 |
| ○ |
Makkoudi, D. (1995). Minéralisations Pb-Ba de M’fiss: Etude Géologique et Contribution à la Gîtologie des Gisements du Tafilalet.
Thèse de doctorat, University Mohammed V, Rabat, Morocco. |
| ○ |
Mandal, S. & Maiti, R. (2014). Role of lithological composition and lineaments in Landsliding: a case study of SHIVKHOLA WATERSHED, DARJEELING HIMALAYA. International Journal of Geology, 4(1): 126-132. |
| ○ |
Marghany, M. & Hashim, M. (2010). Lineament Mapping Using Multispectral Remote Sensing Satellite Data. Research Journal of Applied Sciences, 5: 126-130. https://doi.org/10.3923/rjasci.2010.126.130 |
| ○ |
Matori, A.N.; Basith, A. & Harahap, I.S.H. (2012). Study of regional monsoonal effects on landslide hazard zonation in Cameron Highlands, Malaysia. Arabian Journal of Geosciences, 5: 1069-1084. https://doi.org/10.1007/s12517-011-0309-4 |
| ○ |
Michard, A.; Hoepffner, C.; Soulaimani, A. & Baidder, L. (2008). The Variscan Belt, In: Continental Evolution: The Geology of Morocco: Structure, Stratigraphy, and Tectonics of the Africa-Atlantic-Mediterranean Triple Junction, Lecture Notes in Earth Sciences (Michard, A.; Saddiqi, O.; Chalouan, A. & Lamotte, D.F., Eds.). Springer Berlin Heidelberg, Berlin, Heidelberg, 65-132. https://doi.org/10.1007/978-3-540-77076-3_3 |
| ○ |
Pouclet, A.; El Hadi, H.; Álvaro, J.J.; Bardintzeff, J.-M.; Benharref, M. & Fekkak, A. (2018). Review of the Cambrian volcanic activity in Morocco: geochemical fingerprints and geotectonic implications for the rifting of West Gondwana. International Journal of Earth Sciences, 107: 2101-2123. https://doi.org/10.1007/s00531-018-1590-1 |
| ○ |
Pouclet, A.; El Hadi, H.; Bardintzeff, J.-M.; Benharref, M. & Fekkak, A. (2017). Devonian to Early Carboniferous magmatic alkaline activity in the Tafilalt Province, Eastearn Morocco: An Eovariscan episode in the Gondwana margin, north of the West African Craton. Journal of African Earth Sciences, 129: 814–841. https://doi.org/10.1016/j.jafrearsci.2017.01.030 |
| ○ |
Pour, A.B.; Park, Y.; Park, T.-Y.S.; Hong, J.K.; Hashim, M.; Woo, J. & Ayoobi, I. (2018). Regional geology mapping using satellite-based remote sensing approach in Northern Victoria Land, Antarctica. Polar Science, 16: 23–46. https://doi.org/10.1016/j.polar.2018.02.004 |
| ○ |
Pour, A.B.; Hashim, M.; Hong, J.K. & Park, Y. (2017). Lithological and alteration mineral mapping in poorly exposed lithologies using Landsat-8 and ASTER satellite data: North-eastern Graham Land, Antarctic Peninsula. Ore Geology Reviews, 108: 112–133. https://doi.org/10.1016/j.oregeorev.2017.07.018 |
| ○ |
Pour, A.B. & Hashim, M. (2016). Geological features mapping using PALSAR-2 data in kelantan river basin, peninsular MALAYSIA. International Archives of the Photogrammetry, Remote Sensing and Spatial Information Sciences, 42: 65–70. https://doi.org/10.5194/isprs-archives-XLII-4-W1-65-2016 |
| ○ |
Pour, A.B. & Hashim, M. (2012). Identifying areas of high economic-potential copper mineralization using ASTER data in the Urumieh-Dokhtar Volcanic Belt, Iran. Advances in Space Research, 49: 753–769. https://doi.org/10.1016/j.asr.2011.11.028 |
| ○ |
Pour, A.B. & Hashim, M. (2011). Identification of hydrothermal alteration minerals for exploring of porphyry copper deposit using ASTER data, SE Iran. Journal of Asian Earth Sciences, 42: 1309–1323. https://doi.org/10.1016/j.jseaes.2011.07.017 |
| ○ |
Schowengerdt, R.A. (2006). Remote Sensing: Models and Methods for Image Processing. 3rd Edition, Elsevier. 560 pp. |
| ○ |
Si Mhamdi, H.; Raji, M.; Maimouni, S. & Oukassou, M. (2017). Fractures network mapping using remote sensing in the Paleozoic massif of Tichka (Western High Atlas, Morocco). Arabian Journal of Geosciences, 10(5): 125. https://doi.org/10.1007/s12517-017-2912-5 |
| ○ |
Si Mhamdi, H.; Raji, M. & Oukassou, M. (2016). Utilisationde la Télédétection dans la Cartographie Automatique des Linéaments Géologiques du Granitoïde de Tichka (Haut Atlas Occidental), European Journal of Scientific Research, 142(4): 321–333. |
| ○ |
Silverman, B.W. (1986). Density estimation for statistics and data analysis. In: monographs on statistics and applied probability (Barrie Wetherill, G., Ed.). Springer US, 183 pp. |
| ○ |
Silverman, B.W. (1981). Using kernel density estimates to investigate multimodality. Journal of the Royal Statistical Society: Series B (Methodological), 43: 97–99. https://doi.org/10.1111/j.2517-6161.1981.tb01155.x |
| ○ |
Ta, M.Y.; Kouame, K.F.; Koudou, A.; Adja, M.G.; Baka, D.; Lasm, T.; Lasme, O.D.; Jourda, J.P. & Biemi, J. (2014). Contribution of the Lithostructural Mapping By Landsat 7 Imagery To Study the Precambrian Basement Aquifers in Bondoukou Region (Northeast
Coast Ivory). International Journal of Innovation and Applied Studies, 7(3): 892–910. |
| ○ |
Thannoun, R.G. (2013). Automatic Extraction and Geospatial Analysis of Lineaments and their Tectonic Significance in some areas of Northern Iraq using Remote Sensing Techniques and GIS. International Journal of Enhanced Research In Science Technology & Engineering, 2(2): 11. |
| ○ |
Thomas, R.J.; Fekkak, A.; Ennih, N.; Errami, E.; Loughlin, S.C.; Gresse, P.G.; Chevallier, L.P. & Liégeois, J.-P. (2004). A new lithostratigraphic framework for the Anti-Atlas Orogen, Morocco. Journal of African Earth Sciences, 39: 217–226. https://doi.org/10.1016/j.jafrearsci.2004.07.046 |
| ○ |
Yousefi, T.; Aliyari, F.; Abedini, A. & Calagari, A.A. (2018). Integrating geologic and Landsat-8 and ASTER remote sensing data for gold exploration: a case study from Zarshuran Carlin-type gold deposit, NW Iran. Arabian Journal of Geosciences, 11(17): 482. https://doi.org/10.1007/s12517-018-3822-x |
| ○ |
Youssef, A.M.; Zaghloul, E.A.; Moussa, M.F. & Mahdi, A.M. (2006). Geological structures extraction from remotely sensing data using different techniques and their implementation in mineral exploration and tectonic situation. 6th International Conference on Earth Observation & Geoinformation Sciences in Support of Africa’s Development Conference Paper, 10. |